Understanding the Dashboard: Monitoring Flows, Jobs, and System Health
The Noca AI Dashboard is your central hub for monitoring the health, activity, and performance of your AI automation. From here, you can quickly view flow statistics, job status, and system issues — all in real time. Whether you’re building, debugging, or simply keeping an eye on your flows, the dashboard provides full visibility across your environment.
Watch & Learn
Dashboard Structure Overview
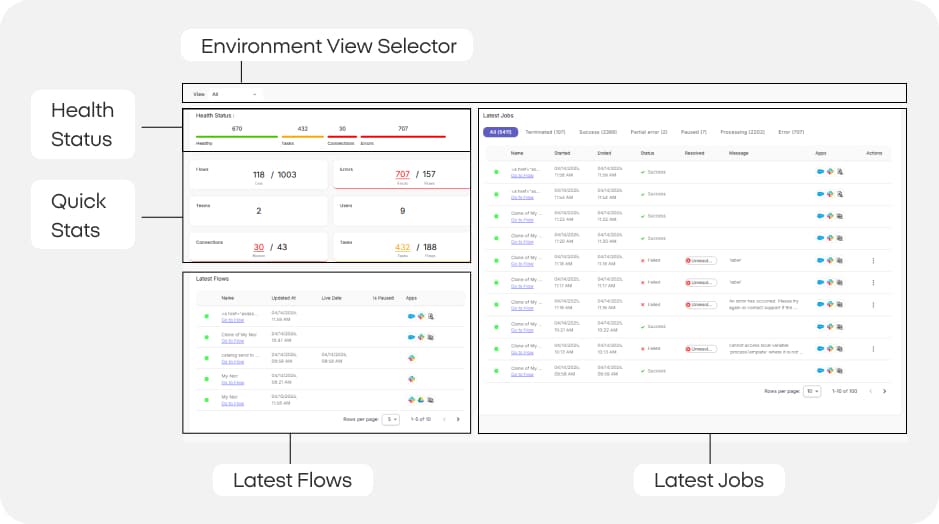
The dashboard is divided into several key sections, each designed to give you a specific type of visibility or control:
Environment View Selector
Choose the environment you want to view (e.g., Production, Staging)
Health Status Panel
Quickly assess the status of flows, tasks connections and job errors.
Quick Stats Tiles
View high-level metrics such as number of flows, users, errors on jobs, and tasks
Latest Flows Preview
Access recently updated flows at a glance
Latest Jobs Activity Feed
Monitor flow execution results and job statuses in real time
All dashboard components — including health indicators, flow stats, and job activity — will reflect data from the selected environment.
1- Filtering Dashboard by Environment
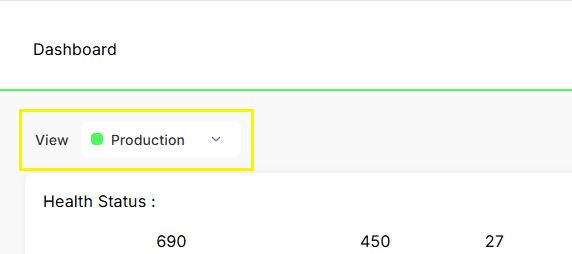
At the top left of the dashboard, you’ll find the Environment view Selector labeled View. This dropdown doesn’t change your active environment, but instead filters the data displayed on the dashboard. You can use it to view metrics and flow activity specific of a particular environment, such as:
Production
Sandbox
Test
2- Health Status Panel
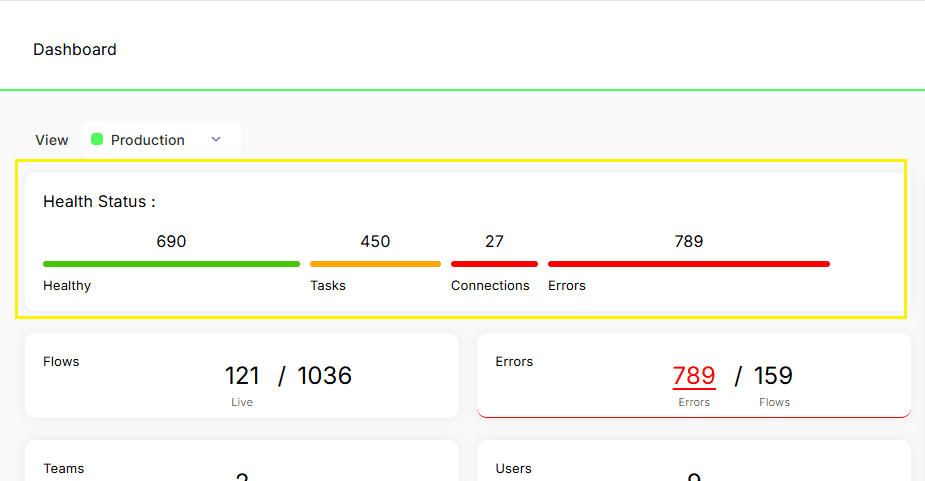
Below the environment view selector is the Health Status, a set of color-coded indicators that give you a real-time snapshot of system status:
🟩 Healthy Flows – Flows that have no tasks and no errors
🟧 Flows with Tasks – Flows that have open tasks such as in complete configurations.
🟥 Broken Connections – Connectors that are not authenticated
🟥 jobs with Errors – jobs that have encountered execution errors
3- Quick Stats Tiles
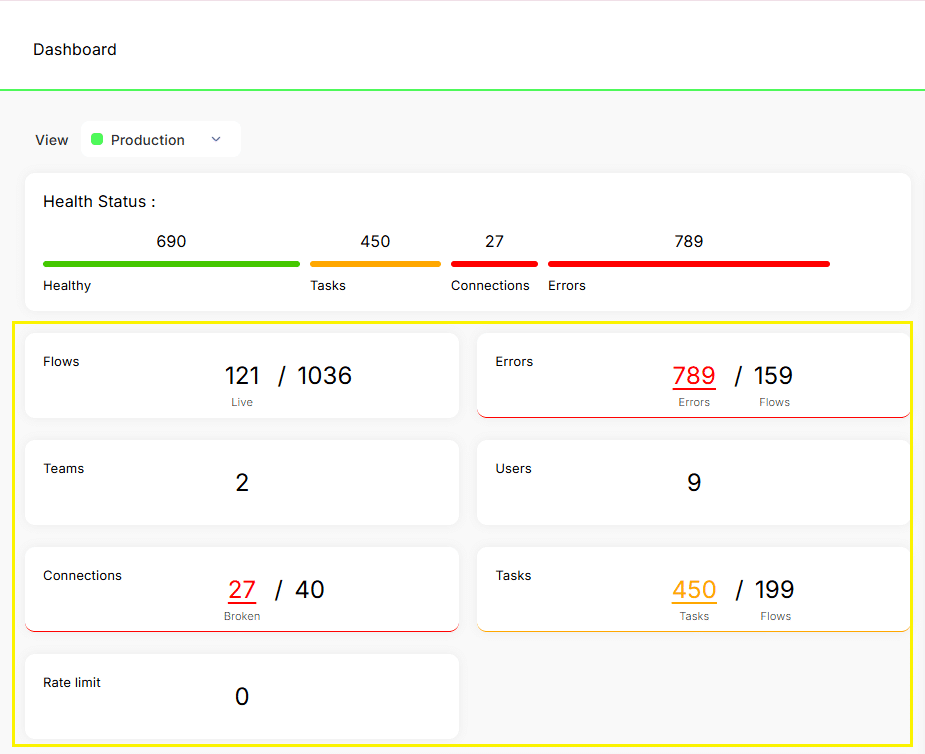
The Quick Stats section summarizes key metrics:
Flows
Total and live flow count
Teams:
Number of teams in the environment
Connections:
Total and broken connections
Errors:
Number of job errors and the flows they belong to
Users:
Total users in the environment20
Tasks:
Number of tasks and the flows they are in.
Rate Limit:
Shows the default rate limit set (maximum number of interactions per minute) for all services/apps across your environment.
Learn more about rate limits
Each number in these tiles is clickable, taking you to a filtered list of flows related to that stat — but only for the environment you’re currently working in.
If you’ve selected a different environment using the Environment View Selector (at the top of the dashboard), clicking a stat tile will prompt you to switch environments. You’ll be asked to confirm before switching. Once confirmed, the system will change environments and take you to the relevant filtered list.
Want to explore stats deeper? See the Flow List Table Guide.
4- Latest Flows Preview
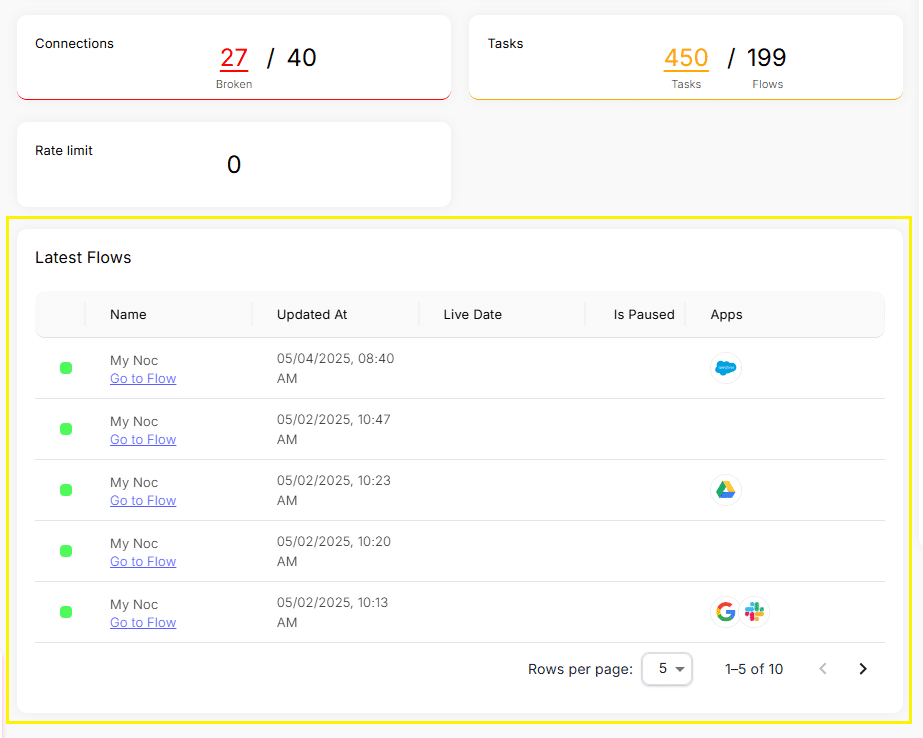
At the bottom left of the dashboard, the Latest Flows Table displays recently updated flows with quick access to:
Environment color icon
Flow name and link
Last updated timestamp
Go-live date (if applicable)
Paused status
Icons for apps used in the flow
This section gives you instant access to flows you’re actively managing.
Also notice that this table has pagination at the bottom of it.
5- Latest Jobs Activity Feed
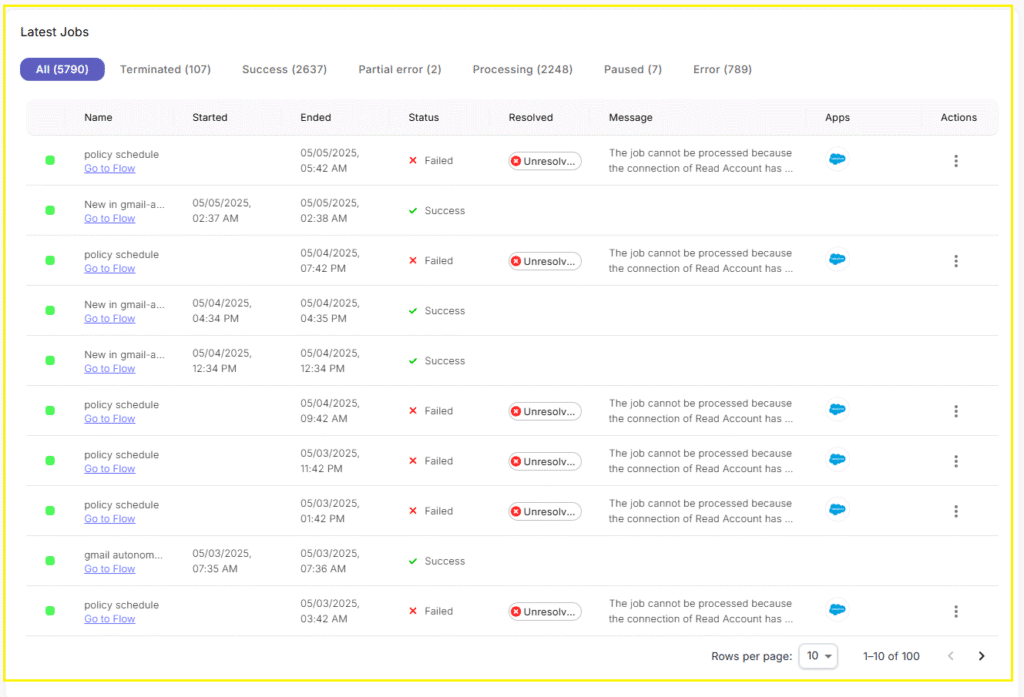
The right side of the dashboard contains the Job Activity Feed, a table showing the latest job executions.
Above this table are tabs you can toggle between to filter the jobs and view:
All Jobs
Terminated
Succeeded
Partial Errors
Paused
Processing
Errors
Each job shows:
Flow name and environment color code icon
Job start and end time
Status (success, processing, paused, etc.)
Resolution status
Error messages (if any)
Apps involved in the execution
“actions” kebab menu for “processing” jobs
that allows you to view job details, pause the job or terminate it.
Learn more about job tracking and error resolution in Job Activity Feed Explained.
FAQs
Can I customize the dashboard layout?
Not at this time, but layout customization is on our roadmap.
How often does dashboard data refresh?
All data is refreshed in real time.
What if I don’t see any flows or jobs?
Make sure you’ve selected the correct environment using the View dropdown