Flow Logs
Overview
The Logs modal in the AI flow builder provides a centralized view of runtime events and system activity for the current flow only. From here, you can monitor integration outcomes, inspect suspended or paused jobs, review scheduled runs, and track event history—all scoped to the flow you’re actively editing.
Where to Find the Logs Modal?
Navigate to:
Left Drawer Menu > Flows > Flow Builder > Header Strip > Logs Icon
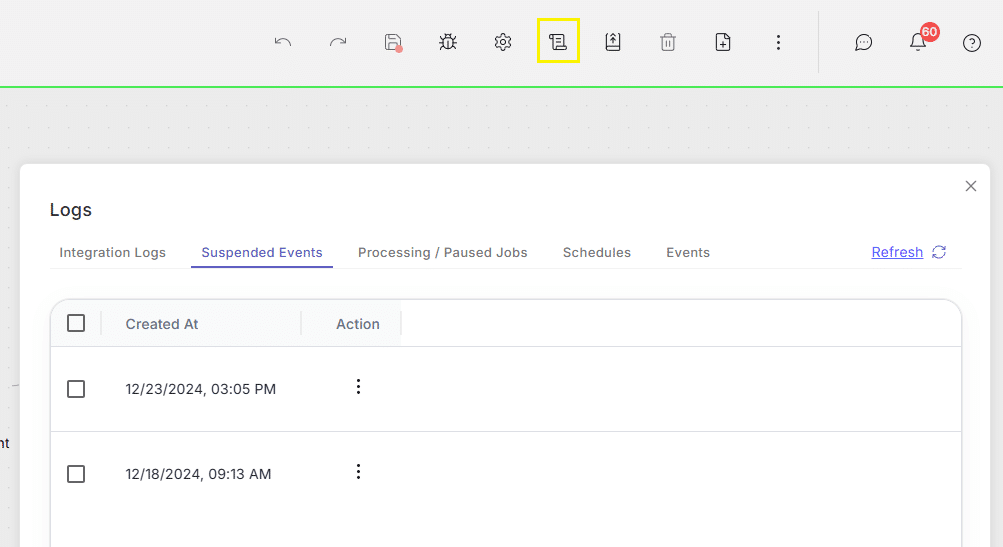
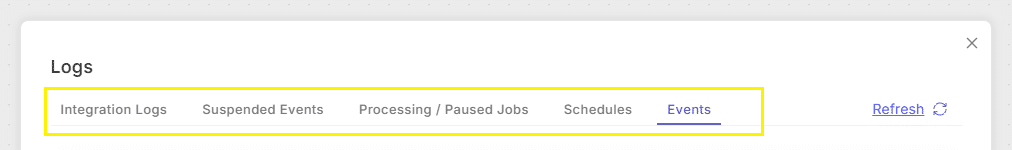
his will open the Logs modal, which is divided into five distinct tabs. Remember: everything you see here pertains exclusively to the flow you’re working on.
Tabs Under Logs
1. Integration Logs
This log is essentially a condensed version of the main Integration Logs (accessed from the left drawer), but only for this flow.
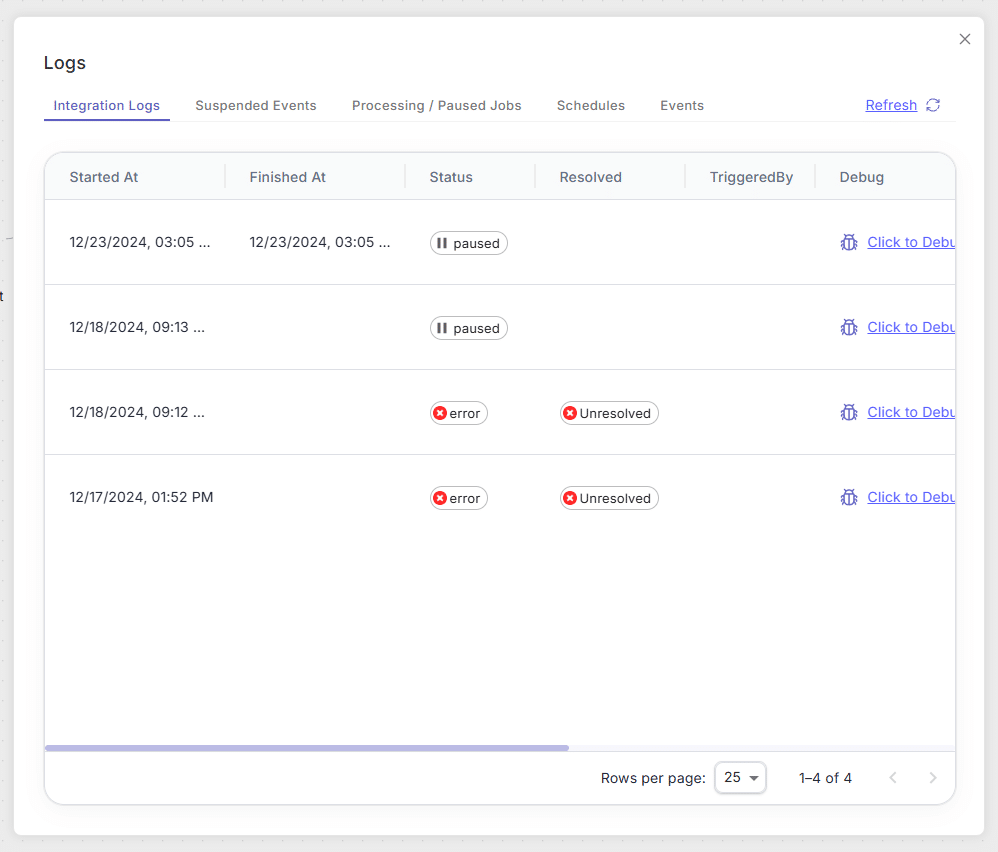
Columns:
tarted At:
Date/time the integration job began
Finished At:
Date/time the integration job completed
Status:
Indicates success or error
Resolved:
Shows whether the issue is Resolved or Unresolved
Triggered By:
Source of the trigger (e.g., Debug run or an event)
Debug:
A link to open the Debug screen for this specific job
Job ID:
Unique identifier for the integration run
Message:
Any error message
2. Suspended Events
What does a “suspended” job mean?
In the Flow Settings, when the “Pause Flow on Error” is ON and “Allow Future Run on Missed Events” is also ON, any error will pause the flow, suspending subsequent jobs until the issue is resolved.
This table shows jobs that were suspended because the flow encountered an error and paused.
Columns:
Checkbox
Select one or more rows
Created At
Date/time the job was suspended
Action (Kebab Menu)
Options to Process or Terminate the individual job.
Batch Actions: You can select multiple suspended jobs via the checkboxes and then click Process Selected or Terminate Selected buttons at the bottom of the table.
3. Processing / Paused Jobs
Displays only the jobs within this flow that are currently Processing or Paused (mid-execution).
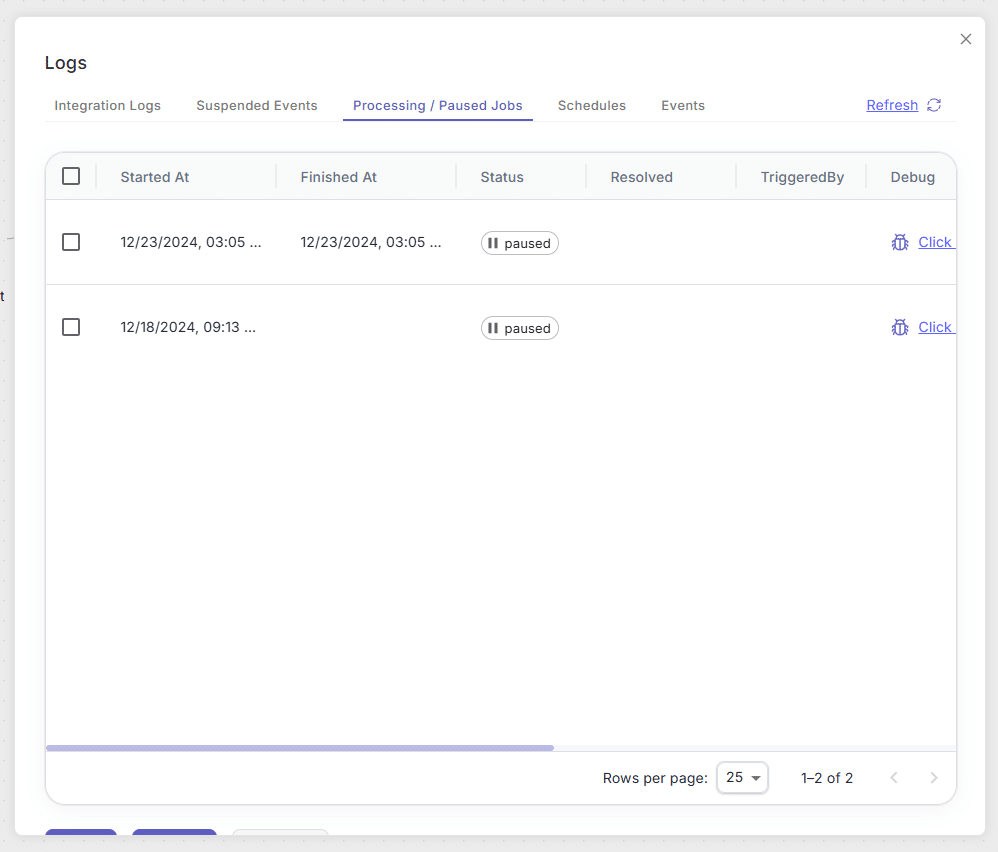
Columns:
Checkbox
elect one or more rows
Started At
Date/time the job began
Finished At
Date/time the job ended (if processing, this may be blank or pending)
Status
Either Paused or Processing
Resolved
Indicates if the job has been resolved or not
Triggered By
Source of the execution (e.g., Debug or an event)
Debug
A link to open the Debug panel for this job
Job ID
Unique identifier for the job run
Message
Error message or status details
Buttons at Bottom:
- Pause Selected: Pauses the selected processing jobs.
- Process Selected: Continues or retries the selected paused jobs.
- Terminate Selected: Stops and terminates the selected jobs.
4. Schedules
Shows all scheduled executions tied to this flow. If your flow has a scheduled trigger, each item appears here.
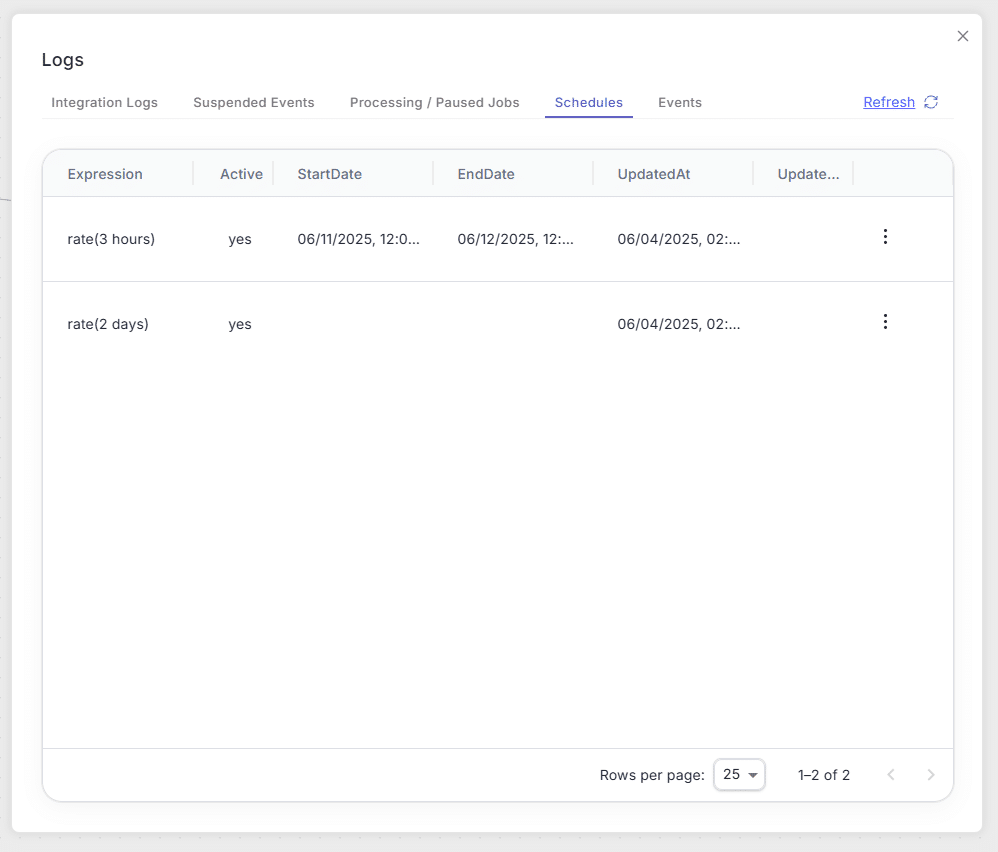
Columns:
Expression
Human-readable summary of the schedule, e.g., rate(3 hours) means a rate-based schedule that runs every 3 hours.
Active
Indicates Yes or No, showing if the schedule is currently enabled (toggle via the kebab menu).
Start Date
Date/time when this schedule began.
End Date
Date/time when this schedule ends (if set).
Updated At
Date/time of the last modification.
Updated By
User who last modified the schedule.
Kebab Menu
Options to Activate, Deactivate, or Delete this schedule.
5. Events
Lists all events tied to this flow (recognized visually by a node-shaped star on the canvas).
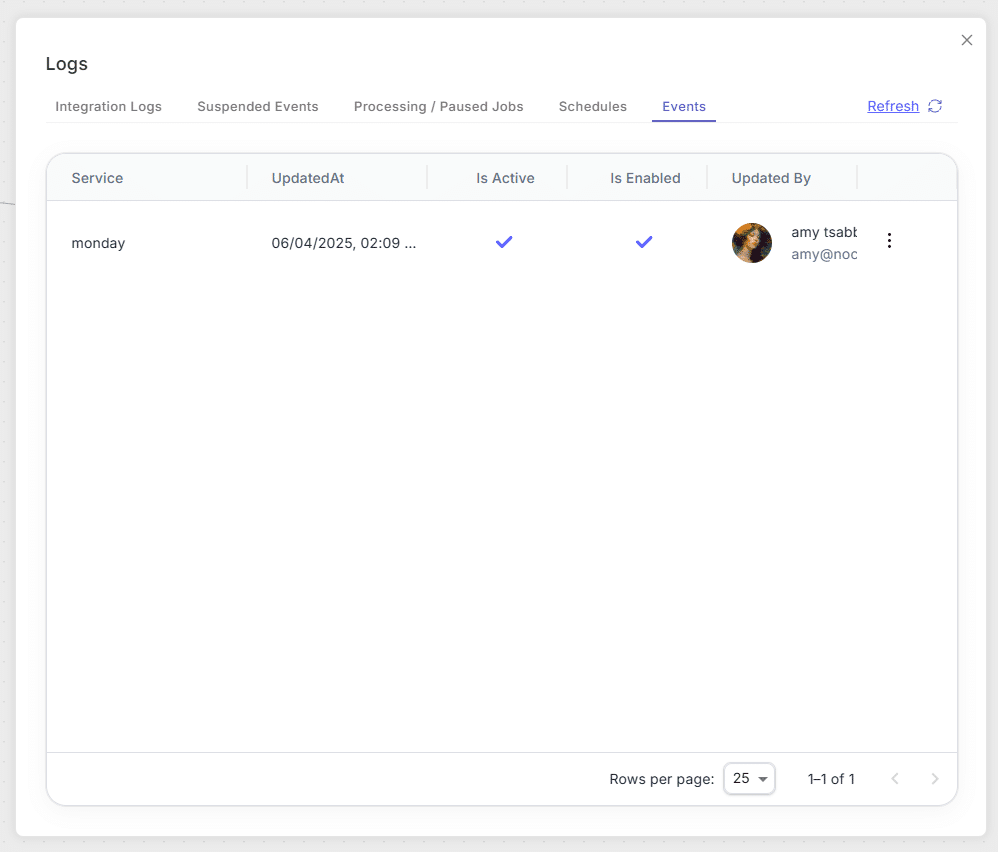
Columns:
Service
Name of the application or service generating the event.
Updated At
Date/time when the event was last modified.
Is Active
Displays a checkmark if the event is active
Is Enabled
Displays a checkmark if the event is enabled
Updated By
User avatar, name, and email of who last updated the event
Kebab Menu
Options to Disable or Delete this event
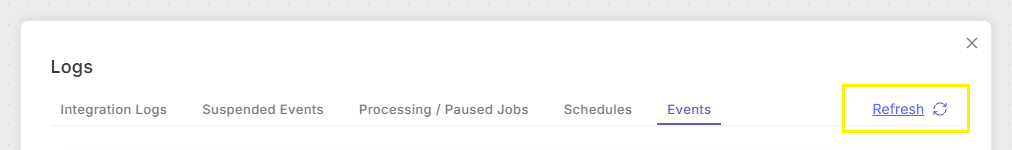
Refresh Button
To the right of the tab list, you’ll find a Refresh button. Clicking it reloads the current tab’s contents, ensuring you see the most up-to-date logs for the flow you’re working on without having to close and reopen the modal.