

Analytics Page Overview
The Analytics page in Noca AI provides an at-a-glance breakdown of your automation activity and credit usage — based on the environment you are currently in.
Watch & Learn
Page Structure
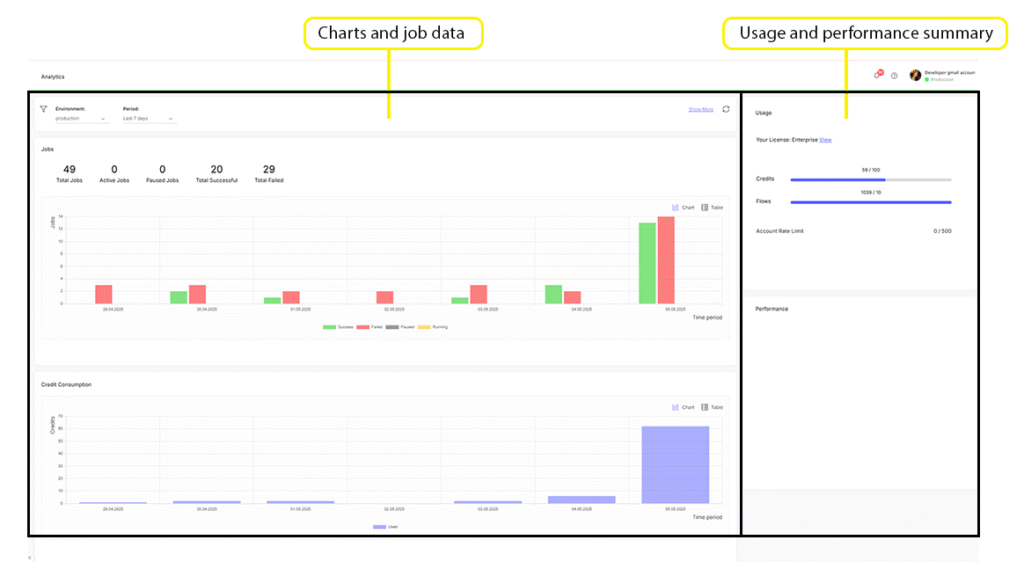
The page is divided into two main sections:
Left Side: Charts and job data
Right Side: License usage and performance summary
Filtering & Controls
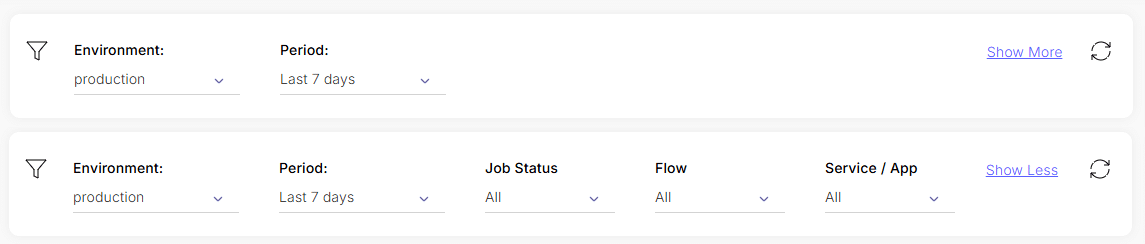
At the top of the chart section, a filter strip lets you adjust the view:
Period Selector:
Last 7 days (default) or Last 30 days
Show More Filters:
- Job Status: All, Success, Failed, Paused, Running
- Flow: All or a specific flow
- Service/App: All or a specific app/service
Refresh Icon:
Reload the chart data
These filters control the data shown in both charts.
Jobs Chart
This section visualizes job volume and performance.
Summary Stats
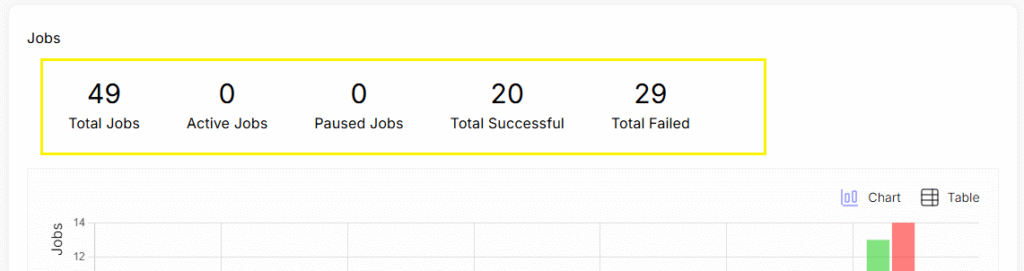
Located at the top of the Jobs chart:
Total Jobs
Active Jobs
Paused Jobs
Total Successful Jobs
Total Failed Jobs
View Modes

Top-right corner of the section:
Chart (default)
Table
Chart View
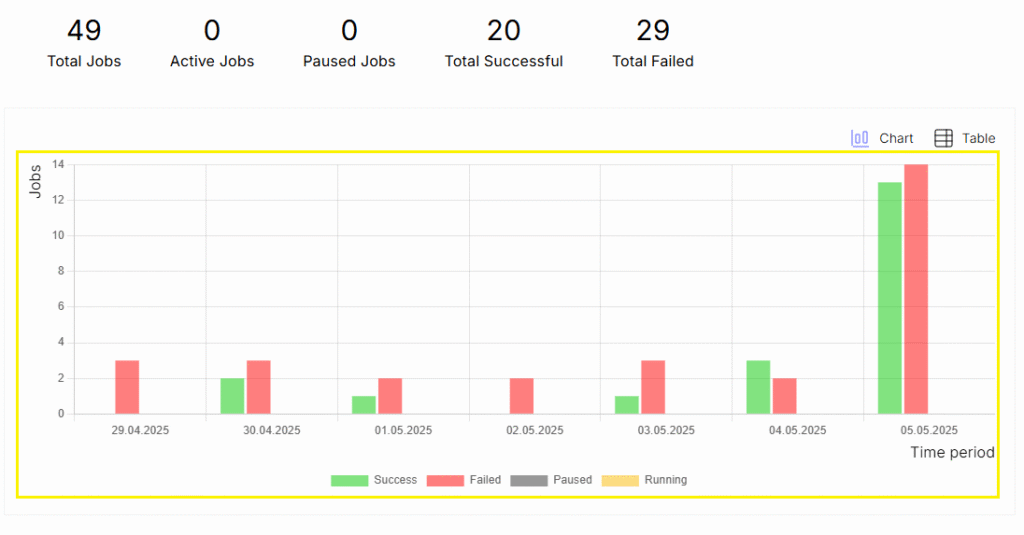
A grouped bar chart shows a daily breakdown of job outcomes. Each day displays four bars:
🟩 Green – Successful Jobs
🟥 Red – Failed Jobs
⬜ Gray – Paused Jobs
🟨 Yellow – Running Jobs
Hovering over a bar shows:
Date
Status
Exact number of jobs
Clicking a bar opens a popup table with:
Start Date & Time
Duration (in seconds)
Total Credits Used
Filtering & Controls
Link to trace flow tasks
Status
Debug link
Flow name
Applications used
Table View
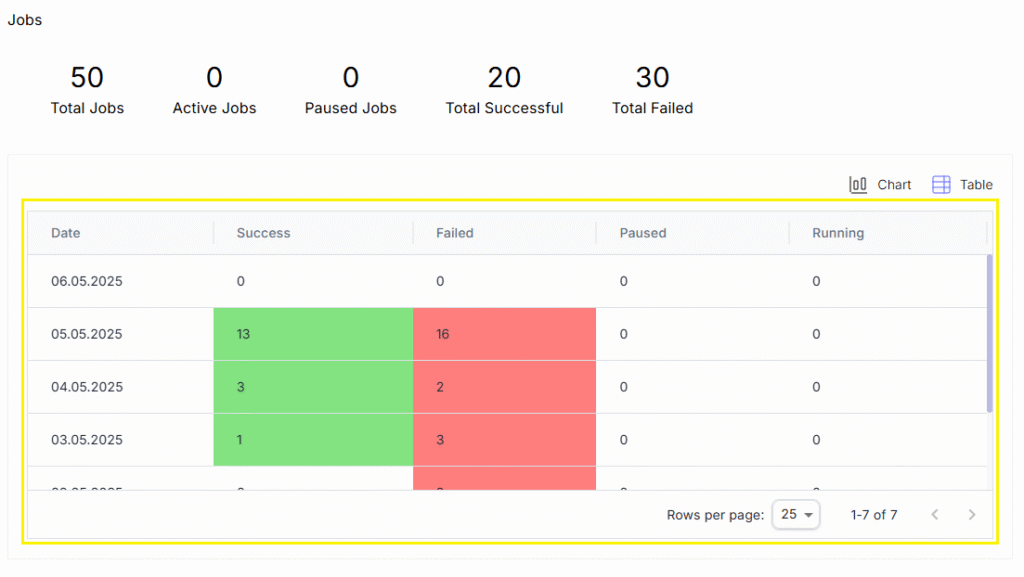
A simplified breakdown:
Each row = a date
Columns for each job type:
🟩 Green – Successful Jobs
🟥 Red – Failed Jobs
⬜ Gray – Paused Jobs
🟨 Yellow – Running Jobs
Clicking any number opens the same job popup table as in chart view.
Credit Consumption Chart
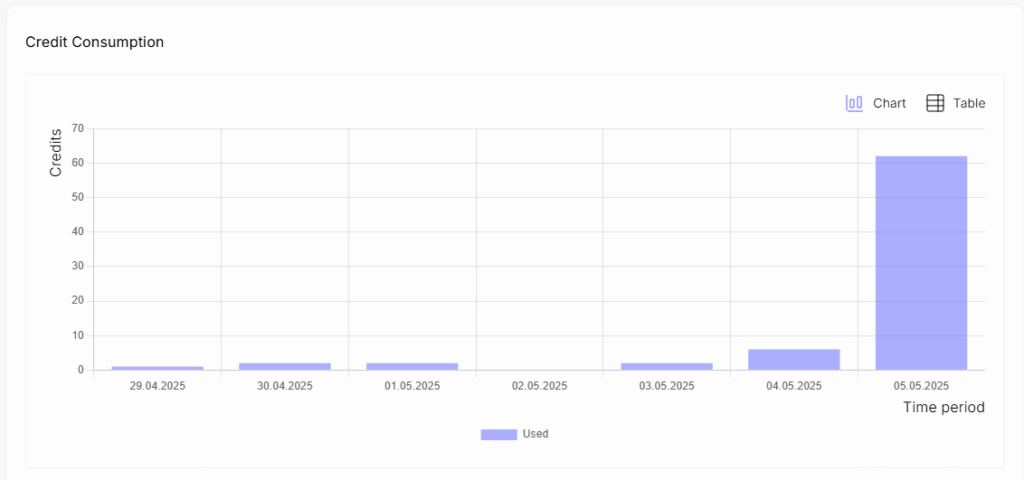
This section shows your daily usage of credits.
View Modes
Top-right corner of the section:
Chart (default)
Table
Chart View
A standard bar chart with:
Purple bars representing daily credits used
🟪 Purple bars
Hovering over a bar shows:
- Date
- Legend label
- Credits used
Clicking a bar opens the job popup table, just like in the Jobs chart.
Table View
Rows show daily breakdowns:
Left column: Date
Right column (purple): Credits used
Right Panel: Usage & Performance
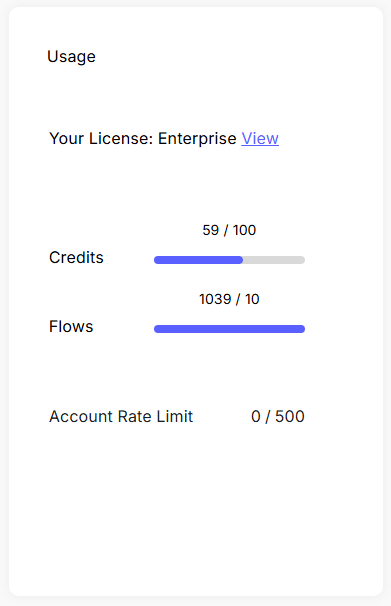
Usage
License Type:
Shown at the top with a link to view license details
Visual Usage Meters:
Credits Meter:
Total vs. used credits (purple = used, gray = total credits in license)
Flows Meter:
Total vs. current flow count in your environment
Rate Limit
A section displaying your current account rate limit
Includes a link to learn more about rate limits
Performance (Coming Soon)
This section is reserved for future performance metrics and insights.
FAQs:
Read some answers on requesntly asked questions in this topic:
Can I log in from multiple devices?
Yes, Noca AI supports multiple devices.